Graph canvas is designed for view draw. It's separated to two
parts in the background - Inner and
Outer canvas.
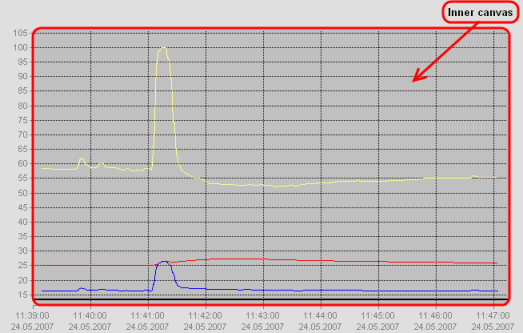
Inner canvas
Inner canvas is the main part of graph canvas where data are
drawn. Inner canvas is limited by axes.
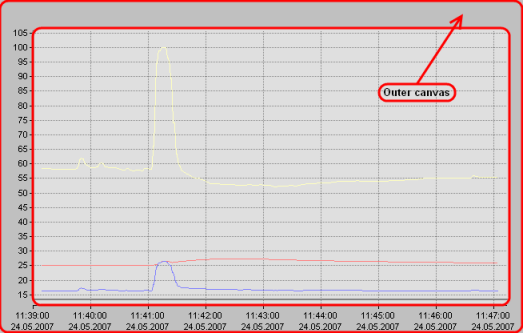
Outer canvas
Outer canvas is the suplement of the inner canvas. It could
contains description of graph items like legend, graph title, axes
captions, etc. Annotation can't be displayed there.